Click here for a comprehensive report by our friends at PropertyRadar.
Here are some of the highlights from PropertyRadar’s May Report:
According to Madeline Schnapp, Director of Economic Research for PropertyRadar, “Sales continue to be lackluster state-wide. Without an increase in affordable inventory, high prices continue to depress sales. Unfortunately, our 2016 forecast of anemic sales in the face of high prices and low inventory is shaping up to be right on.”
“Despite lower year-over-year sales volumes, cash sales continue to represent one in four transactions. As the yield on the 10-year U.S. Treasury note continues to fall, parking cash in real estate continues to look attractive. We believe one of the reasons cash purchases remain high is due to a phenomena we have named ‘Millennial Phantom Ownership’. It appears there are increasing numbers of parents and grandparents of Millennials buying houses and condominiums as a place for their children to live while they attend college or start new careers and ‘safely’ park cash.”
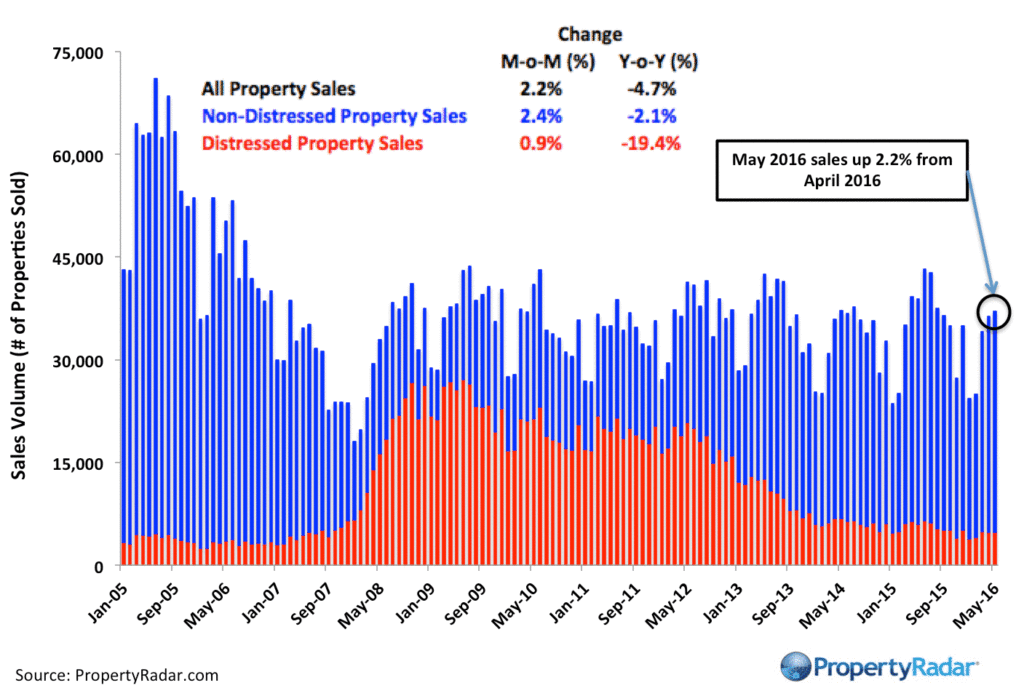
Home Sales – Single-family residence and condominium sales by month from March 2005 to March 2016 divided into distressed and non-distressed sales. Distressed sales are the sum of short sales, where the home is sold for less than the amount owed, and REO sales, where banks resell homes that they took ownership of after foreclosure. All other sales are considered non-distressed.
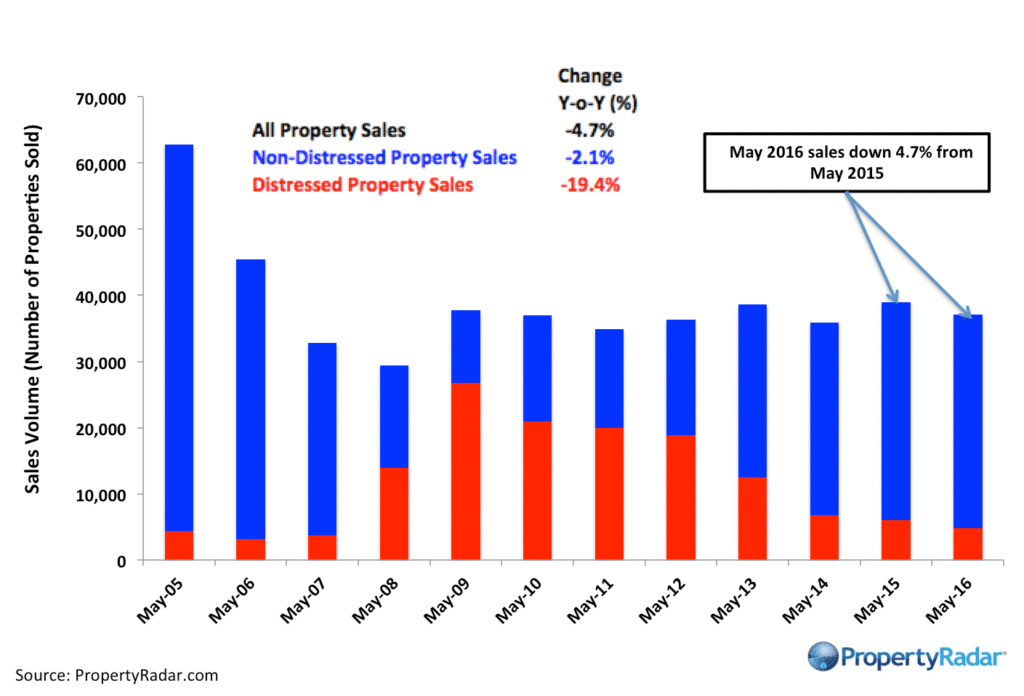
Year-over-Year Home Sales – Single-family residences and condominiums sold during April from 2005 until 2016 divided into distressed and non-distressed sales.
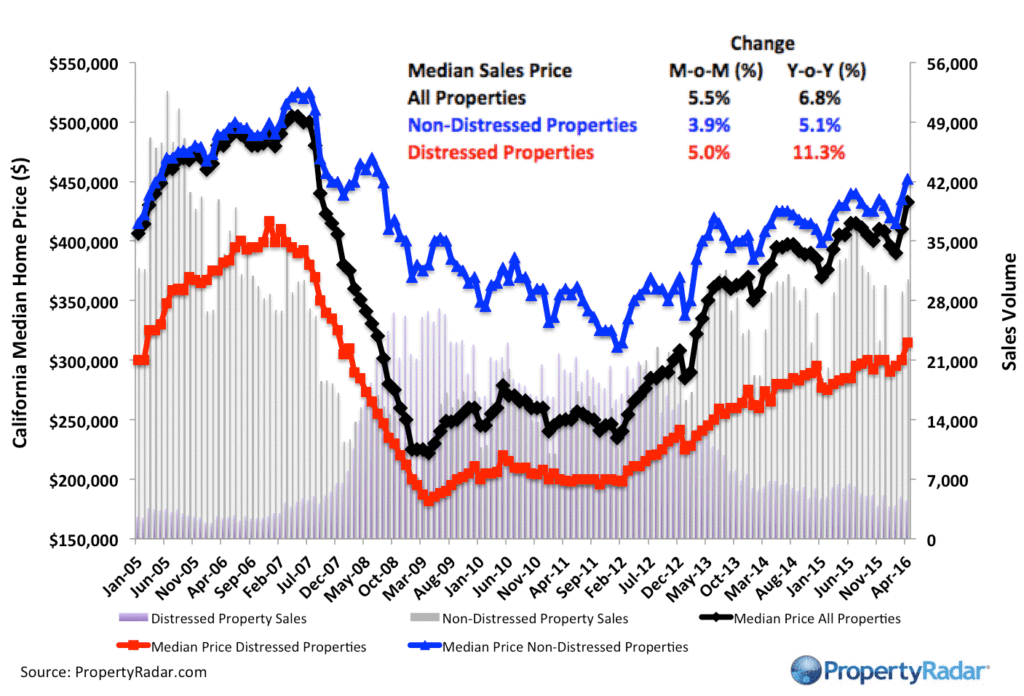
Median Sales Price vs. Sales Volume – Median sales price (left axis) of a California single family home versus sales volume (right axis), by month from 2005 to current. Median sales prices are divided into three categories: All single-family homes (black line), distressed properties (red line), and non-distressed properties (blue line). Monthly sales volumes (right axis) are illustrated as gray and lavender bars. The gray bars are distressed sales and the lavender bars are non-distressed sales.
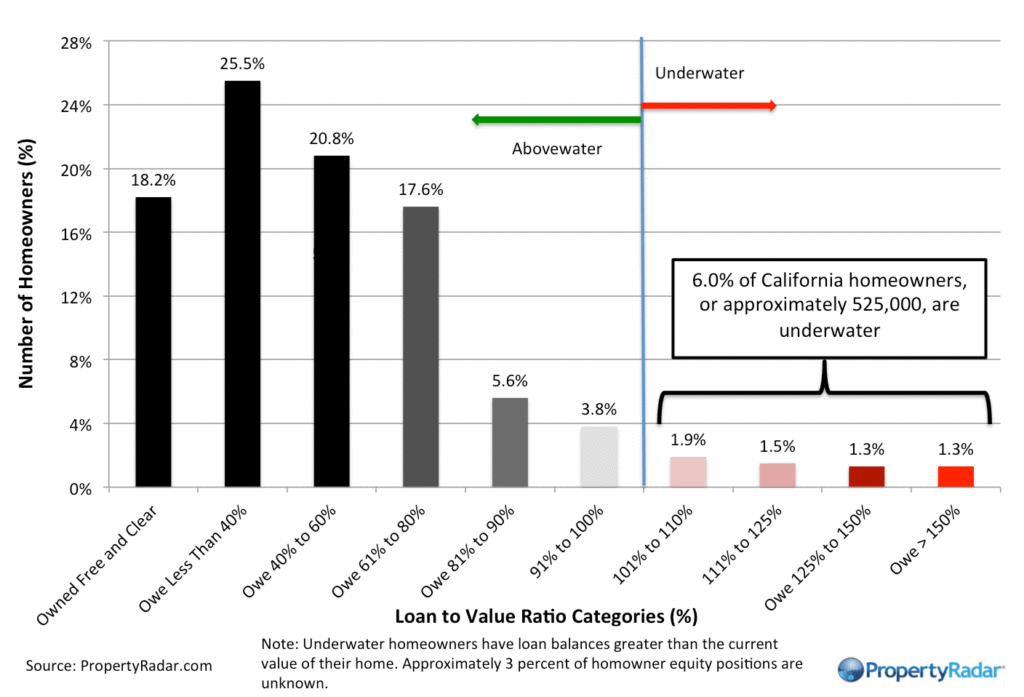
California Home Owner Equity – A model estimate of California homeowners segregated into various categories of levels of homeowner equity for a given month. Homeowner numbers represent a percentage of total California homeowners.
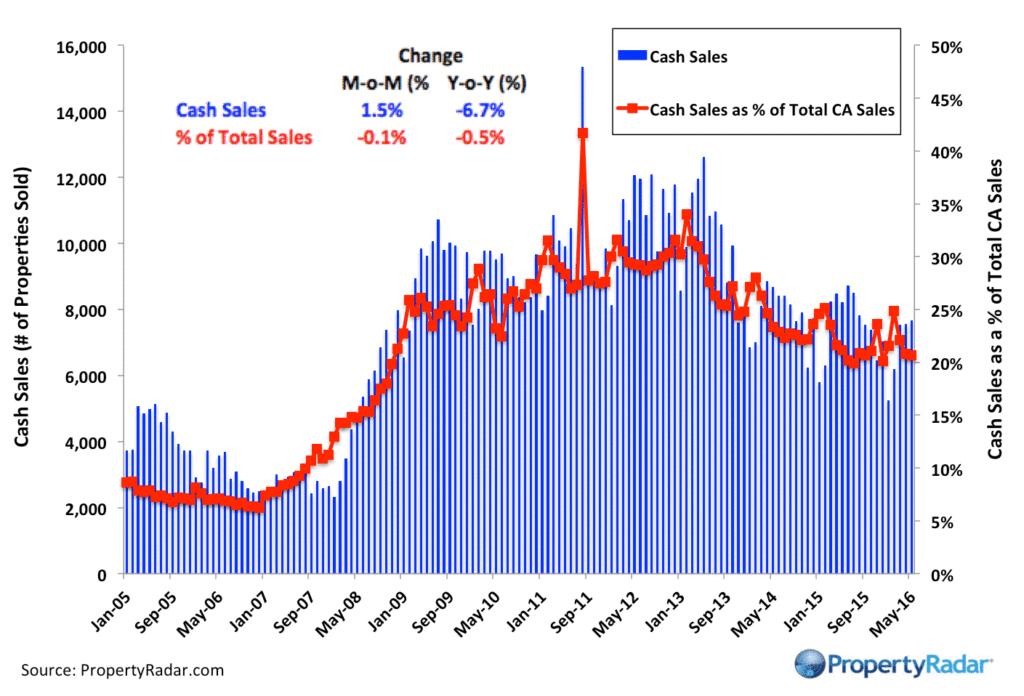
Cash Sales – The blue bars (right axis) illustrate cash sales of single-family residences and condominiums by month. The red line (left axis) illustrates cash sales as a percentage of total sales by month.
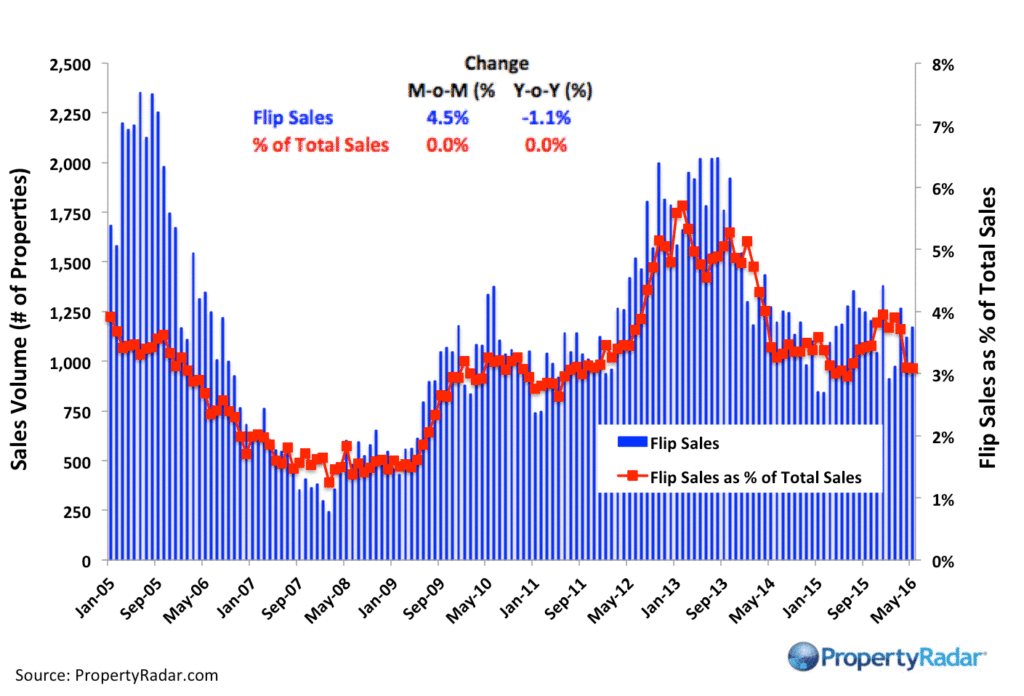
Flipping – The number of single-family residences and condominiums resold within six months from 2005 to 2016.
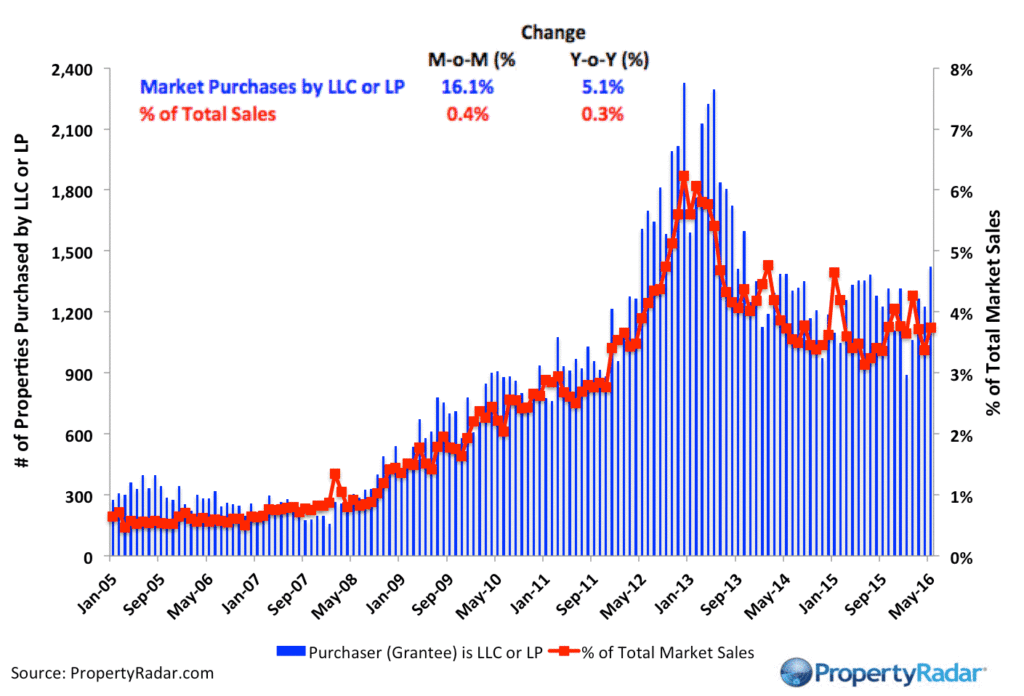
Market Purchases by LLCs and LPs – The blue bars (right axis) illustrate market purchases of single-family residences and condominiums by LLCs and LPs from 2005 to current. The red line graph (left axis) illustrates LLC and LP purchases as a percentage of total sales by month.
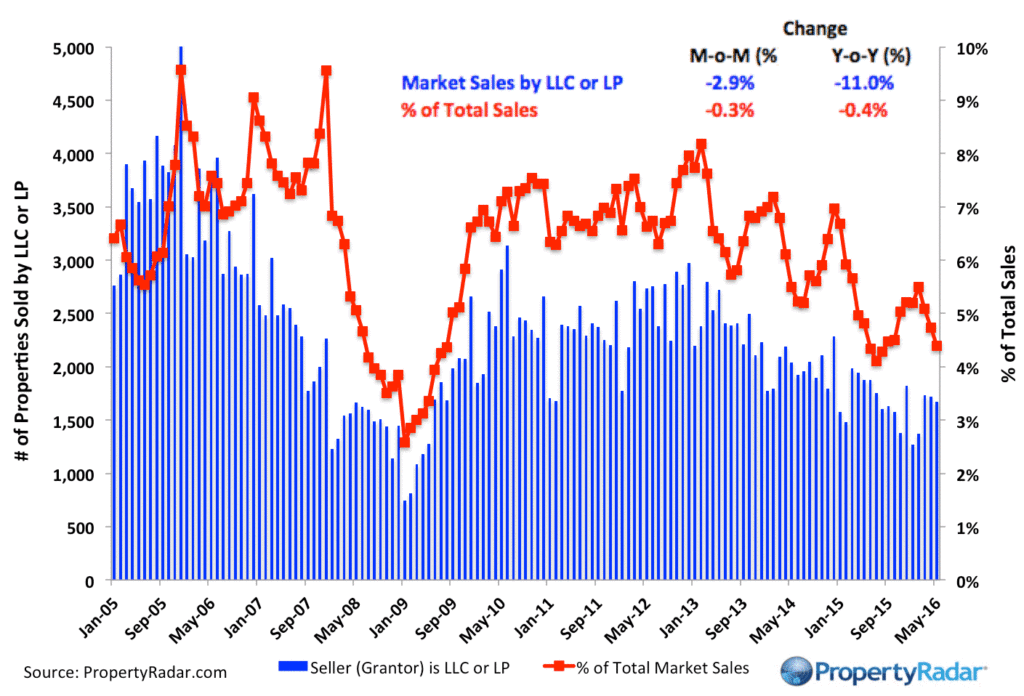
Market Sales by LLCs and LPs – The blue bars (right axis) illustrate market sales by LLCs and LPs of single-family residences and condominiums by month. The red line graph (left axis) illustrates sales as a percentage of total sales by month.
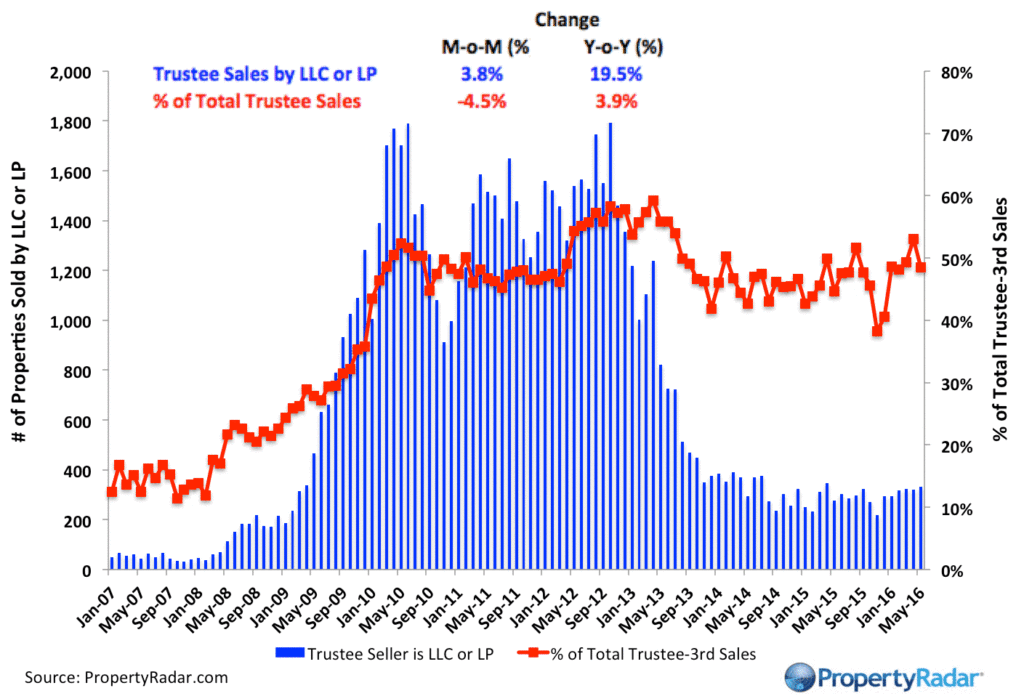
Trustee Sale Purchases by LLCs and LPs – The blue bars (right axis) illustrate trustee sale purchases (foreclosure sales) of single-family residences and condominiums by LLCs and LPs from 2007 to current. The red line graph (left axis) illustrates purchases as a percentage of total trustee sales by month.
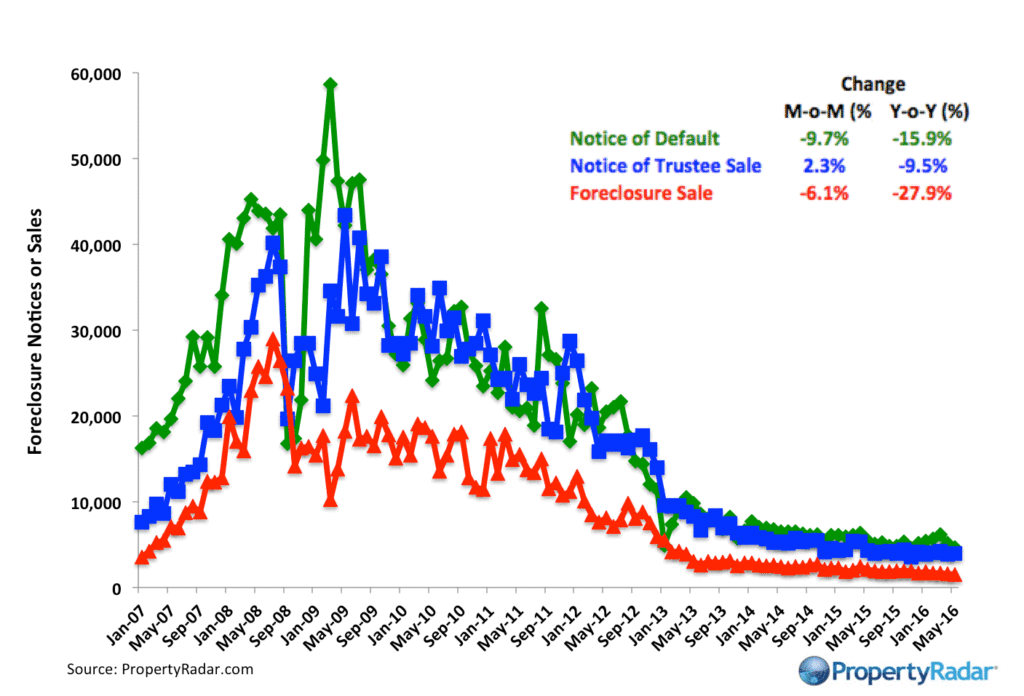
Foreclosure Notices and Sales – Properties that have received foreclosure notices — Notice of Default (green) or Notice of Trustee Sale (blue) — or have been sold at a foreclosure auction (red) by month.
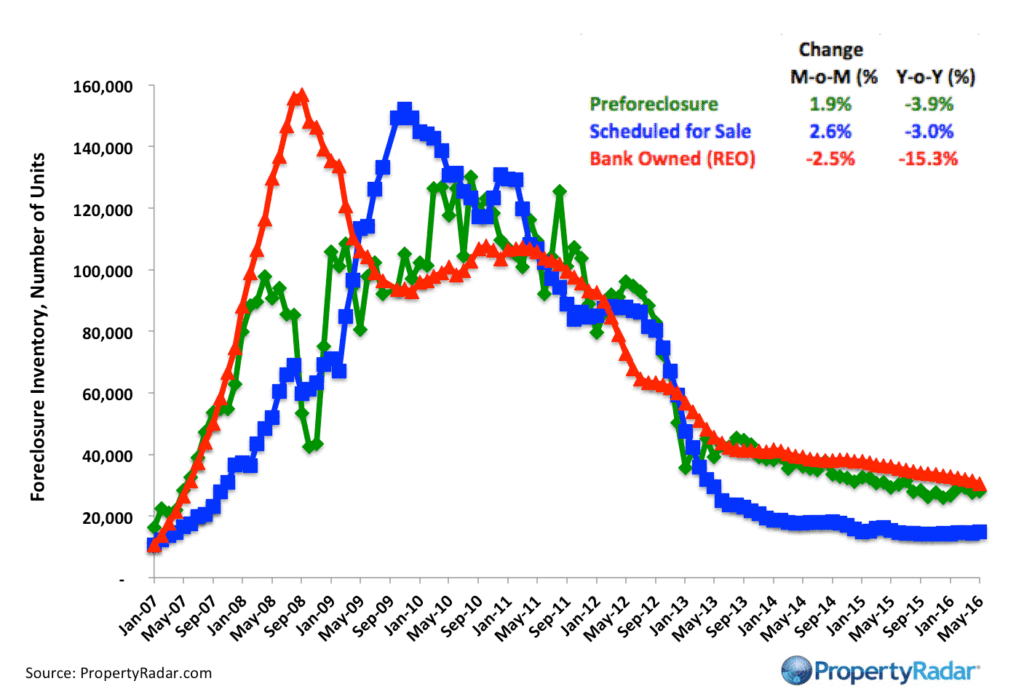
Foreclosure Inventory – This graph shows Preforeclosure Inventory, Scheduled for Sale Inventory, and Bank-Owned (REO) Inventory, by month. Preforeclosure inventory estimates the number of properties that have had a Notice of Default filed against them, but have not been Scheduled for Sale. Scheduled for Sale inventory represents properties that have had a Notice of Trustee Sale filed, but have not yet been sold or had the sale cancelled. Bank-Owned (REO) inventory means properties sold Back to the Bank at the trustee sale and the bank has not resold to another party.


If you enjoy learning about investment strategies, this guide is the perfect download!
We developed this guide as a reference for professional real estate investors. We hope you learn something new and, for the things you already know, this could be a refresher to reinforce good habits for continued prosperity.
In this guide we've compiled some of our best material, all related to fix and flip projects.
This Guide covers: